When I was 17, I got my first job as a secretary. One of my responsibilities was tracking the company’s finances in a logbook. Yes, an actual physical logbook. 😂 There was nothing fancy about it. I recorded the numbers, kept everything organized, and made sure we knew where the money was going.
Around the same time, I started tracking my own expenses. I was earning my own money for the first time, and I wanted to understand where it was going. I’ve always believed that we can’t fix something we don’t know. If I wanted to manage my money better, I first needed to understand how I was spending it. I didn’t know it then, but that simple habit would stay with me for years.
The tracker grew with me
Eventually, my personal expense tracking moved to Google Sheets. The first version was simple: record the expense, categorize it, and see where my money went. Years later, I worked in workforce management, where spreadsheets became part of my everyday job. As I learned more about formulas, lookups, reporting, and organizing data, I kept applying those skills to my own tracker.
Whenever I learned something useful, I would think, Wait… I can use this on my tracker. And I usually did. 😂 Over time, formulas replaced manual calculations, categories became summaries, and individual transactions became monthly trends. I never really sat down one day and decided to build the perfect expense tracker. The tracker simply grew with me.
Turning it into a portfolio project
My personal tracker only needs to work for one person: me. When I decided to turn the idea into a portfolio project, I wanted to make it a little more challenging. I didn’t want to create a random spreadsheet just so I could say, “I know Google Sheets.” I wanted to take something I actually use and see how I could build it as a system for someone else.
That became the Automated Finance Tracker & Dashboard. For the demo, I created a fictional dataset with 1,000+ transactions across two credit cards and two cardholders: Alex, the primary cardholder, and Jaime, the supplementary cardholder. Now the tracker needed to show more than where the money went. It needed to show who was spending, which card was being used, whether each category was within budget, how spending changed over time, and whether anything unusual might need attention.
The two card tabs feed into Raw - Combined Data, which became the single source of truth for the workbook. From there, the system creates summaries by category and user, compares budget versus actual spending, calculates month-over-month changes, and flags unusually high transactions.
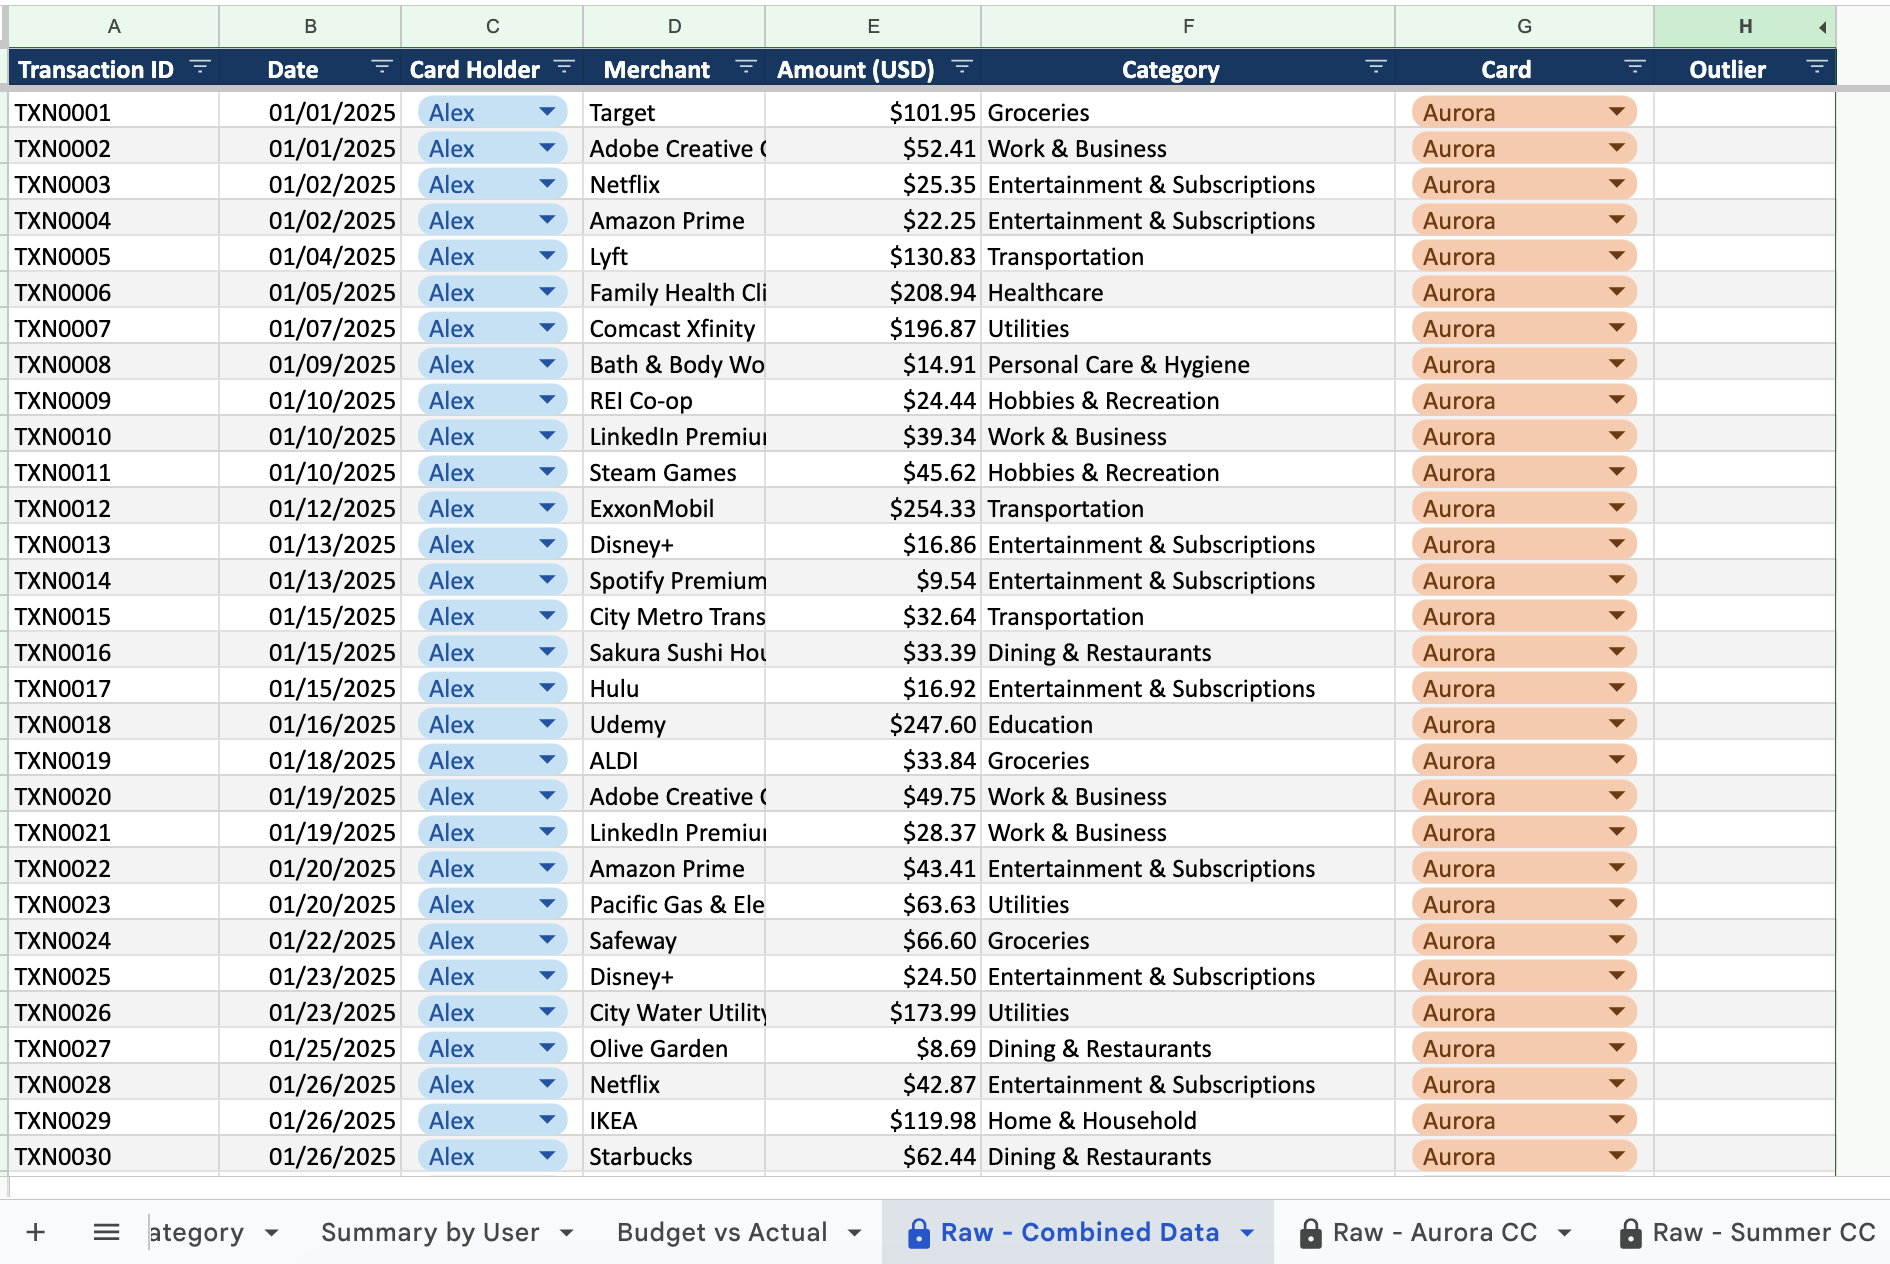
I especially like the outlier flag because it doesn’t automatically decide that a transaction is a problem. It simply tells you that something might be worth checking. That’s how I like to think about automation in general: a system doesn’t always need to make the decision for us. Sometimes it just needs to show us where our attention is needed.
Making the complicated part simple
Once the reporting was working, I built the Dashboard. There are more than 1,000 transactions, formulas, lookups, validation rules, and calculations behind it, but the person looking at the dashboard shouldn’t have to understand all of that. They should be able to open it and quickly understand what they need to know.
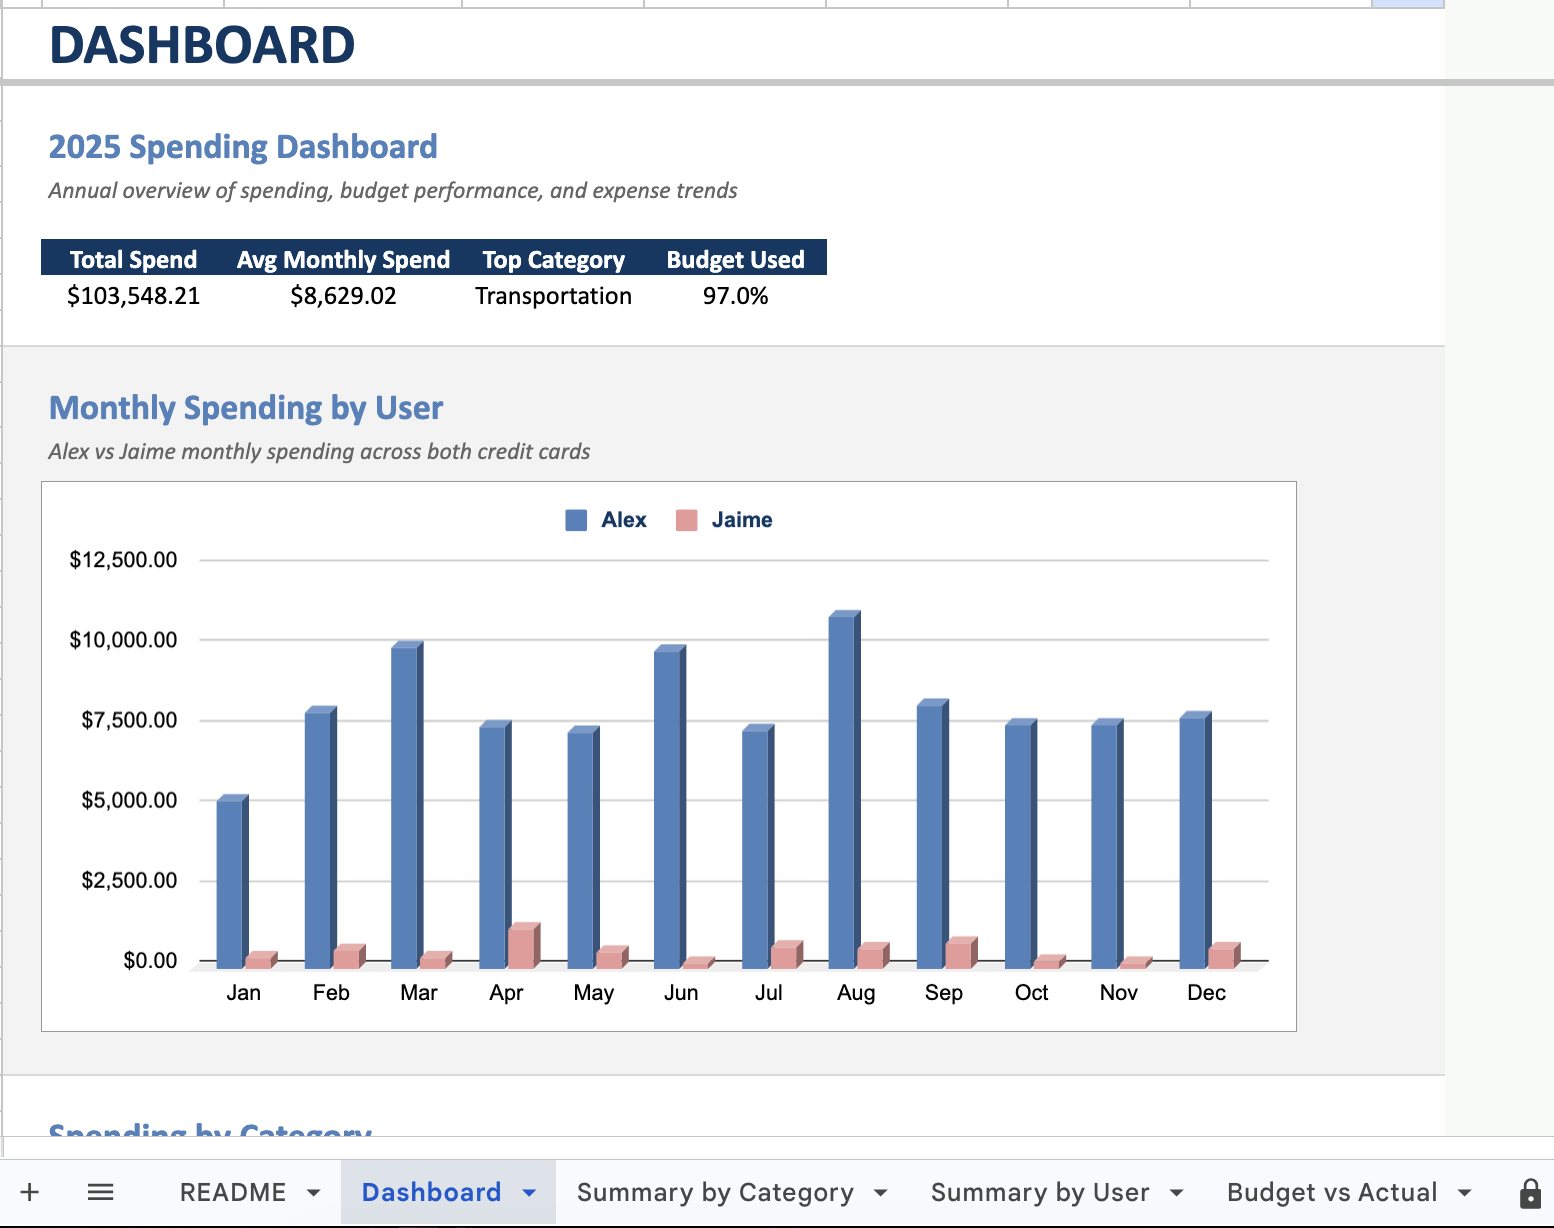
That’s something I’ve learned from working in operations too: complexity can live behind a system, but using it should still feel simple.
Of course, getting there wasn’t exactly smooth. I dealt with inconsistent dates, categories that needed cleaning, formatting differences between the cards, pivot tables that needed rebuilding, and some very strange row numbering. I built something, broke something, fixed it, found another thing, and fixed that too. 😂 During final QA, I even found two rows that said “Over Budget” while the rest of the system used “Exceeded Budget.” The calculations were correct; the terminology wasn’t.
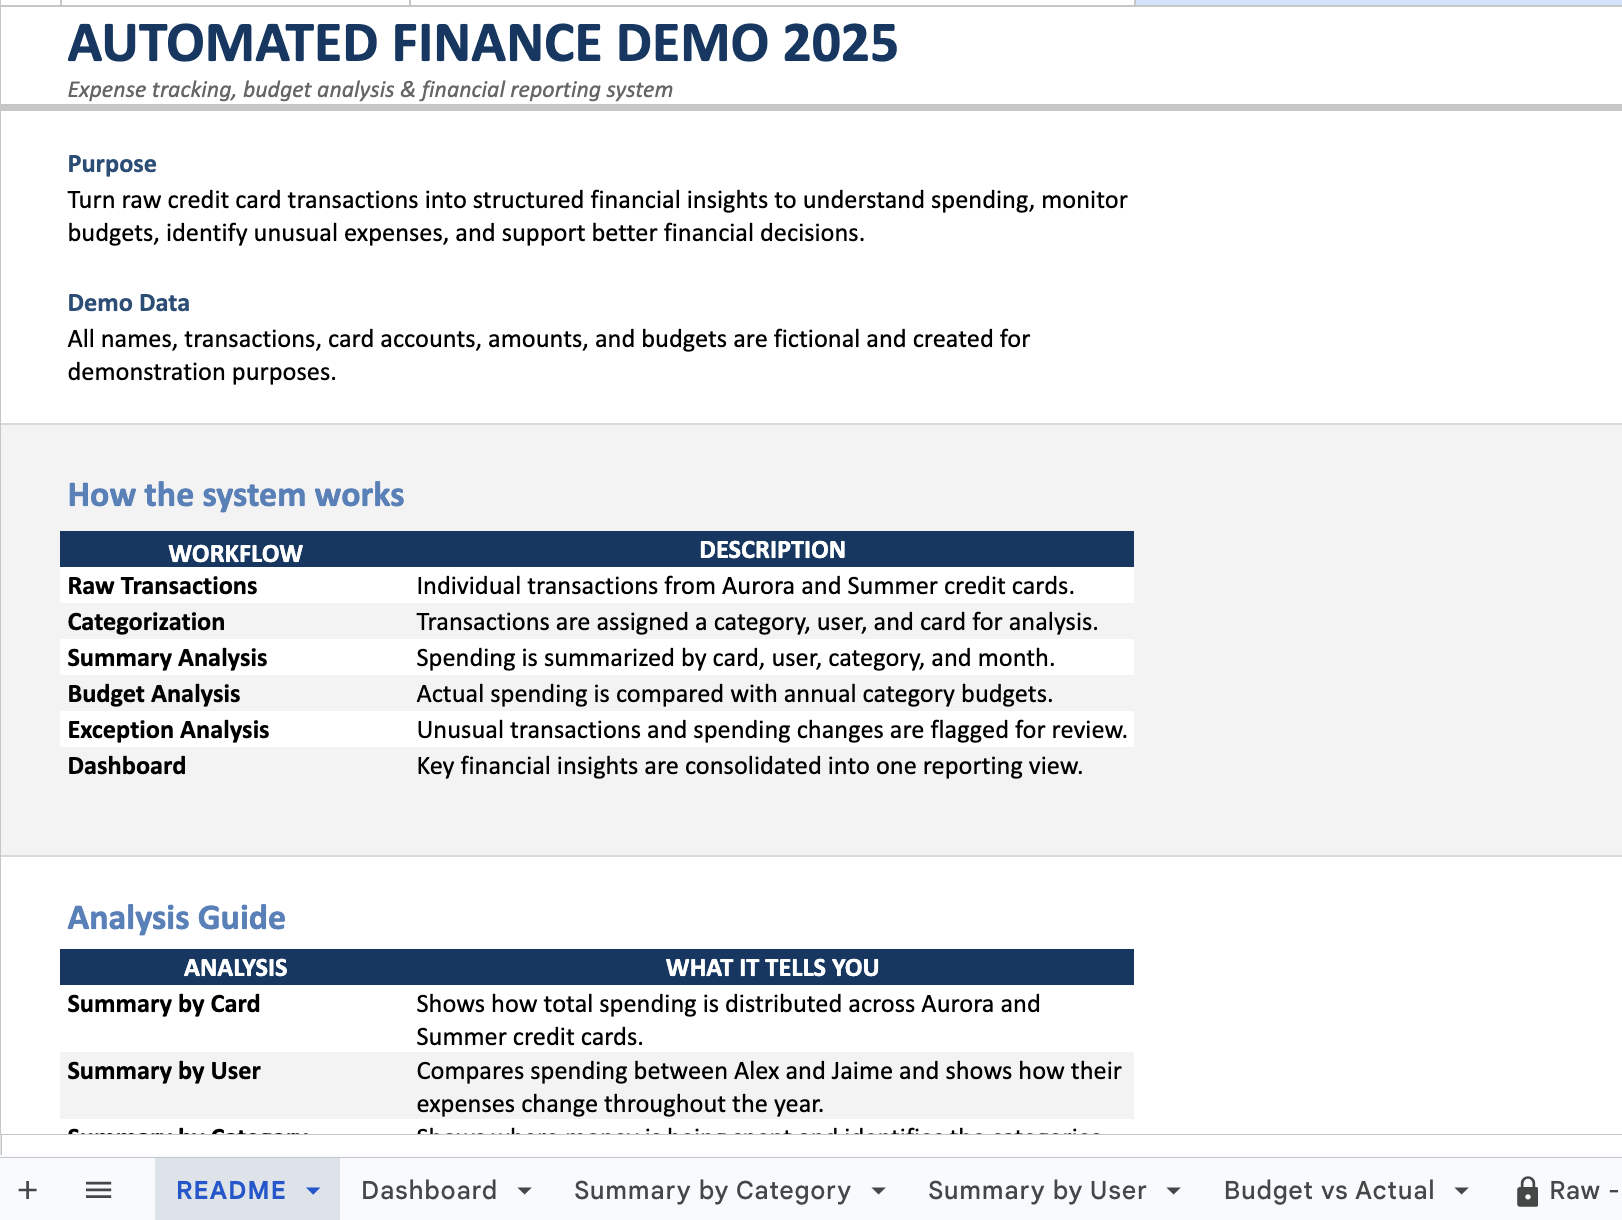
It was tiny, but those things matter. A useful system isn’t just one that produces the correct answer. It also needs to be consistent, understandable, and maintainable. That’s also why I added a README explaining how the workbook works. I know how everything works because I built it, but someone else should be able to understand it too. Documentation is part of the system.
Knowing where the money goes
Expense tracking, for me, has never really been about spending as little money as possible. One idea that stayed with me from Morgan Housel’s The Psychology of Money is thinking about money as a tool for building the kind of life we want. For me, part of that is being able to sleep well at night.
I don’t track my expenses to make myself feel guilty about spending. I track them because I want to understand how and where I’m choosing to spend my money. Sometimes the numbers tell me I need to adjust; sometimes they tell me I’m actually doing fine. Both are useful. Instead of wondering whether I spent too much this month, I can look at the numbers and know.
From a logbook to AI
This might be my favorite part of looking back at how all of this evolved. At 17, I was writing financial records in a physical logbook. Later, I manually entered expenses into Google Sheets. Then formulas and automation started doing more of the work. Today, I can upload my credit card statements and use AI to help extract and organize the transactions and give me an overview of what my spending looks like.
Something that once required writing every number by hand can now begin with: Here are my credit card statements. Tell me what happened.
But better tools don’t remove the need to understand the process. AI can help process the information, Google Sheets can organize and calculate it, and a dashboard can make it easier to understand. I still need to decide what matters, what looks unusual, what deserves attention, and whether the output is actually correct.
The tool changed. The thinking didn’t.
After all these years, it still comes back to the same reason I started tracking expenses in the first place: we can’t fix something we don’t know. And sometimes, once we know, we realize there’s nothing to fix at all.
The spreadsheet is just the tool I happen to be using now.
Want to see how it works?
I built the Automated Finance Tracker & Dashboard using fictional demo data so I could share the working spreadsheet publicly. You can explore the transactions, summaries, budget monitoring, monthly trends, automated flags, and dashboard yourself.